

In his regular column, Oliver Grievson, Associate Director AtkinsRéalis and Royal Academy of Engineering Visiting Professor at the University of Exeter, provides an in-depth review of the EA’s storm overflow performance for 2024.
Each year, event duration monitoring (EDM) figures are published by the Environment Agency revealing water company storm overflow performance. It is a day some look forward to, so that the “miserable” performance of the water industry can be highlighted. For those working in the industry there can be an impending sense of dread, as all of the hard work of the past year is torn down in a matter of a day.
The 2024 calendar year was no different. Politicians marked the storm overflow performance as “a disgrace”. However, if you ignore the rhetoric, what was the actual performance and how did it compare to previous years?
2024 – a wet year?
The water industry is heavily affected by wet weather. Persistent rainfall, tidal affects and groundwater levels all add to the problem. We know from records that 2023 was a wet year and this time last year the headlines talked about the worst year ever on record….but what happened in 2024? The figures show that the number of overflows fell slightly but the duration of overflows increased, at least in some areas.
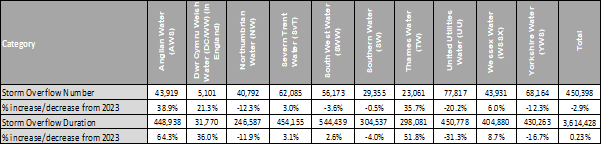
There was a 2.9% decrease in the number of overflows in 2024 and a 0.23% increase in the duration. Water companies in the North of England saw between a 12% to 20% decrease in the number of storm overflows whereas from the Midlands down to the Thames region the number increased, ranging from 3-6% in the West to 35-38% in the East, as well as a significant increase in Wales.
When we look at storm overflow durations we see a similar but worse pattern, the North of England performed better, the highlight being United Utilities recording a 31.3% decrease in the time of storm overflows. However, official figures show a significant increases in the duration of the storm overflows in two water companies.
So, why was this?
- Both 2023 and 2024 were wet years with significant increases in rainfall over the long-term average.
- East and Central England experienced large increases in rainfall, with both February and September 2024 being particularly bad months.
- In the North of England rainfall was more consistent with 9 months in 2024 seeing increased rainfall over the long-term average but nothing above 100% over average (i.e. a doubling of rainfall).
- The dry period in August followed by the wet period in September 2024 caused a large number of storm overflows due to the problems encountered when a dry period is followed by a significantly wet period.
To compare 2024 figures accurately it’s helpful to look at the long-term trends of water company performance.
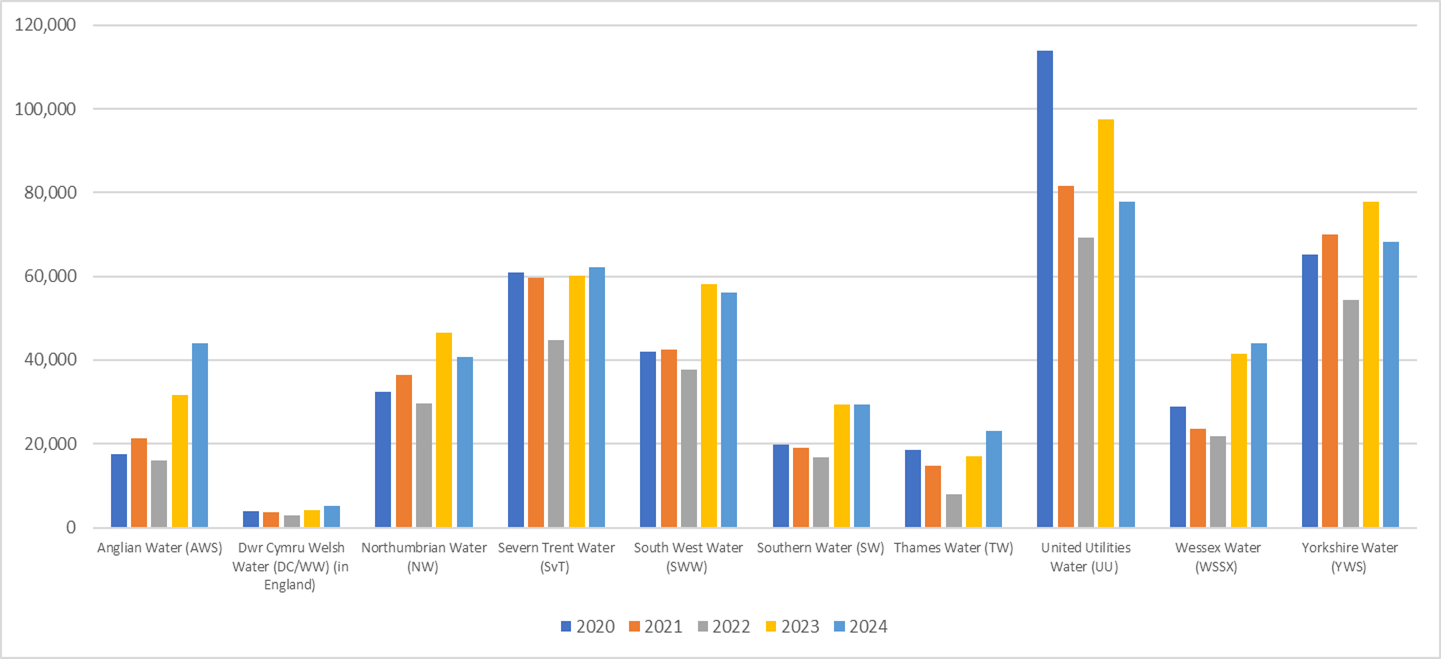
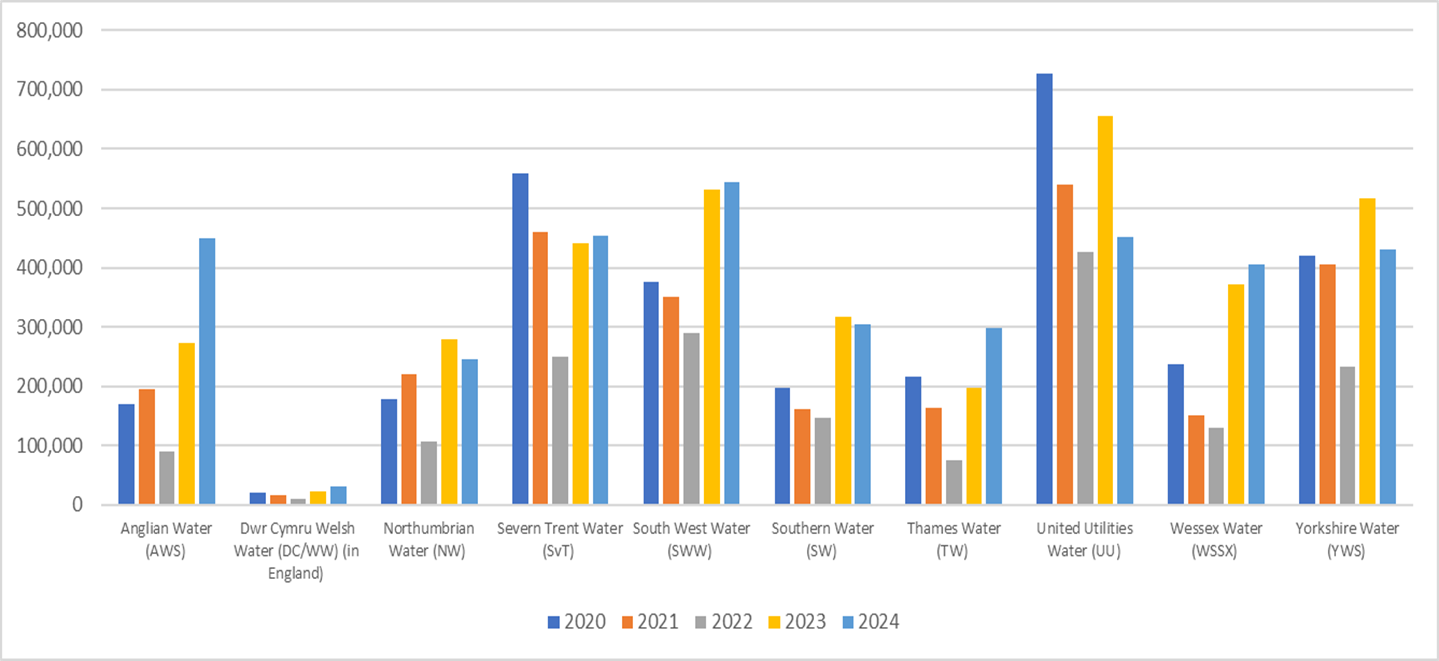
Figures 2 and 3 highlight some interesting patterns and trends. But to truly understand the data we need to understand the number of storm overflow monitors. Let’s look at United Utilities. 2020, 2023 and 2024 have been the wettest years in the past five years. Comparing 2024 to 2020 we see that there has been a 31.7% decrease in the number of storm overflows and a 37.9% decrease in the overall storm duration. United Utilities has 15.9% of the overall number of storm overflow monitors and yet only account for 12.5% of the total duration of storm events. In contrast, 30% of Anglian Water’s monitors were installed or commissioned in 2023.
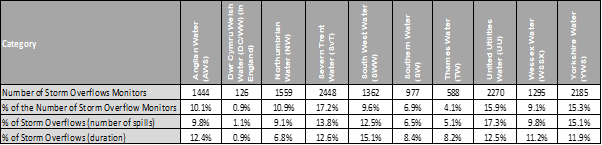
Figure 4 compares the percentage of storm overflow monitors in each company and then looks to see if they have more or less than the total percentage of storm overflows in terms of numbers and duration of storm events on a proportional basis. From this it can be seen that Severn Trent Water has 17.2% of the monitoring asset base across the UK but only accounts for 13.8% of the storm overflows and 12.6% in the duration of storm events. In a similar pattern Yorkshire Water has 15.3% of the storm overflow monitors and only 11.9% of the duration, which puts them on a par with neighbouring United Utilities.
More monitoring to come
The storm overflow monitoring that we see today is pre-dominantly from the wastewater network and represents data from event duration monitoring that does not fall under a quality control scheme. The water industry has been doing significant work over the past five years to increase the amount of monitoring in the 2020-2025 investment period.
It is in this period that the industry and public has seen all of the data published, a requirement under Section 81 of the Environment Act 2021. It’s now live for all to see but comes with the caveat that the data is largely not checked. Moving forward, the monitoring that has been installed, under the Environment Agency MCERTS Scheme, is also due to be published. Data from all of the Event Duration Monitors will be published not just at 15-minute periods but potentially move to a 2-minute monitoring frequency. This is a big ask for the industry to achieve and the cost of transmitting all of the data will be significant.
The challenge
The challenge will be making all of this data contextual. People will need to understand where it fits within the wastewater system, and where the event duration monitoring is connected and part of the same system. Without this level of detail, how will the public understand what event duration monitor connects to another event duration monitor and the impact that all of this has on the nation’s rivers? And that’s without the next piece of the jigsaw, when the Continuous Water Quality Monitoring Programme and the monitoring of emergency overflows comes on-line over the next ten years.
Because data is only as good as our ability to interpret it.

